Creating a curve in the geometry tab
Observing the link between dynamic geometry and graphic representation
The purpose is to show how functional modelling helps to approach a calculus notion.
The goal is to study the differential quotient for a point on the graph of a cubic function.
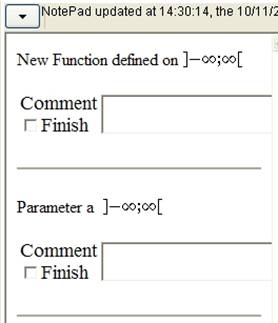
First create the function f(x) = 2 x^3-x and the parameter a in the function list.
Creating a curve in the geometry tab
Switch to the geometry tab and select Create Object / Curves.
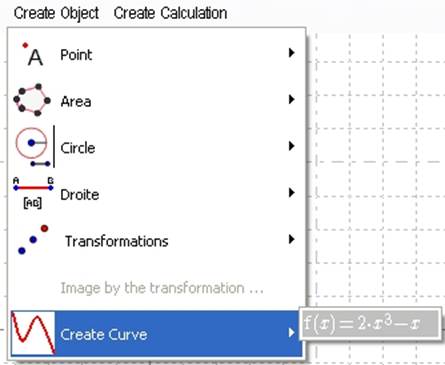
Figure 125- Menu Create Object / Create Curve
The curves of the function displays.
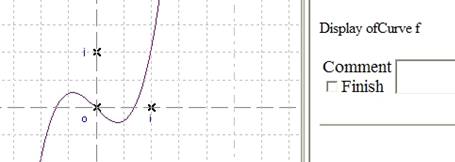
Figure 126 - Displaying of the curve
Studying a gradient
Then create the coordinate point A (a, f(a)). Note that A moves on the curve when you animate the parameter a.
Create M, a free point on the curve (Create Object / Point / Free Point on Curve). Note that M moves on the curve when you drag it with the mouse.
Create the calculation (yM-yA)/(xM-xA) corresponding to the differential quotient relative to A. Observe the values of the quotient when M is near A for various values of a.
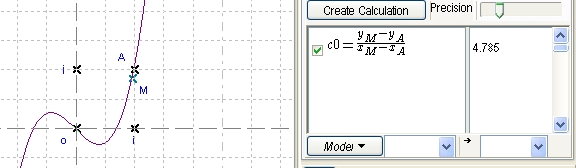
Figure 127 - Calculation value and representation
Create the calculation (xM – xA) which you will use like preimage.
Create in the x-value list, the value zero (x1 = 0). Model the function c1 -> c2. Then, clicking on Auto, the correct domain of definition appears. Validate with OK and click on Exit.
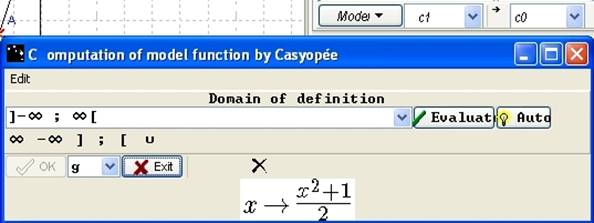
Figure 128 - Calculus "Derivative number"
In the graphic tab, you can graph the function g and ask the limit when x approaches 0 (xM approaches xA) which is the differentiated number of f in a.
- either when the parameter is instantiated
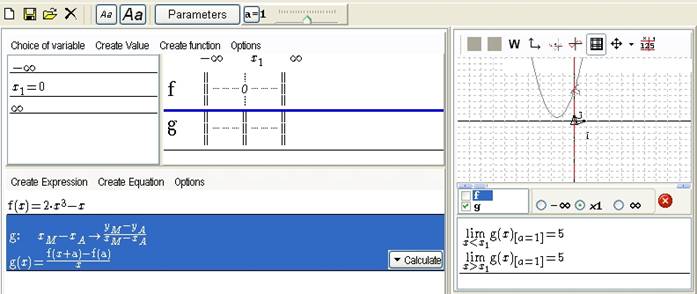
Figure 129 - Formulas with instantiated parameter
- either when the parameter is “formal”
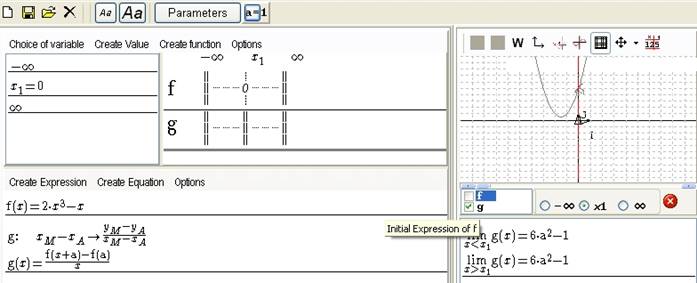
Figure 130 Formulas with formal parameter
Observing the link between dynamic geometry and graphic representation
In the geometry tab, you can display the geometric aspect of the problem and in the graphic tab, the curve of the quotient values. A moving in one tab leads to a moving in the other tab.
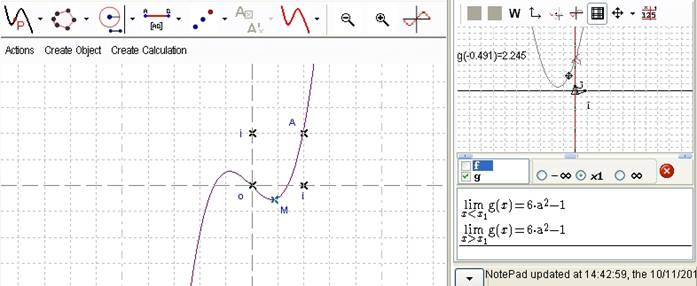
Figure 131 -Geometry and graphic tabs
 Preview
 Print...


