

We wish to define the function of repartition for the normal law and to know the critical value for the 0,95 threshold
We shall use the first item by formula of the entry Create function in the Algebra menu.
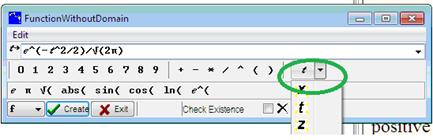
As a difference with Figure 3 - Expression creation box, the dialog box includes a button for entering the independent variable identifier. Note that several identifiers can be chosen, x being proposed as a default. Note also that, optionally, like for expressions, it is possible to ask Casyopée to check whether the function defined by the formula is actually defined for all real numbers (check box Check Existence).
|
|
|
|
Figure 31 - Create function by formula |
|
After the function has been defined, the Calculate button offers three additional calculations, specific for the functions. We try here the entry “anti-derivative” whose result is the standard normal cumulative distribution with a constant difference. Since the function obtained is null for t=0, we define a function g by adding ½. (Create function / by formula then enter the formula 1/2+If(t)).
Note the buttons at the bottom of the graphic tab that allow graphing functions and calculating limits. In the tool bar at the top of the tab, several zooming are accessible with one button. Here, to correctly frame the curve, it has been necessary to zoom in y several times, and to zoom in x once. Axis have also been moved simply by dragging the graph with the mouse. Framing would also have been possible by entering numbers by way of the W button or by dragging the axis unit arrows. Another possibility is via a “zoombox”. Maintain the Ctrl key down, click a corner of the rectangle you want to zoom in, and drag towards the opposite corner. After confirming, the graph will fit into your rectangle.
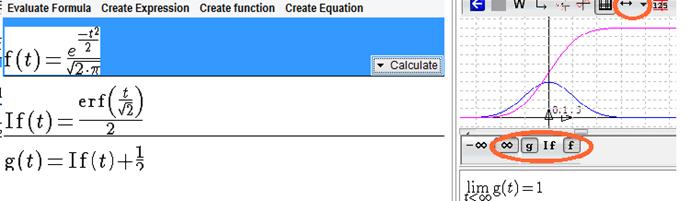
Figure 32 - Functions, graphs and limits
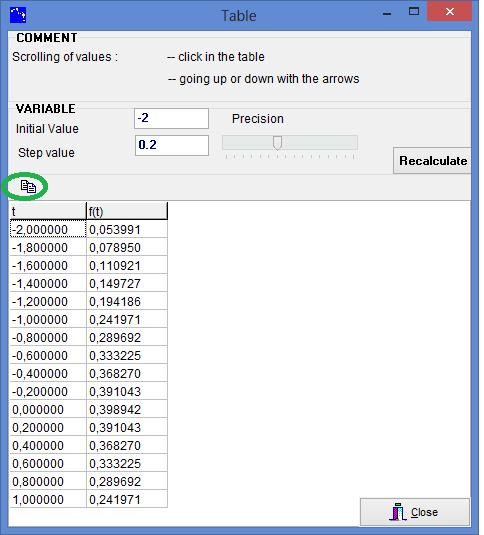
Figure 33 - Tabulating a function
We now approach the critical value of the standard normal law at the level of 0.95. For a graphical study one can enter a constant function h and point the intersection of the graphs in order to move a cursor and to read approximate values.
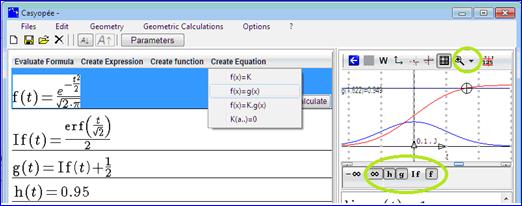
Figure 34 - Graphical study
|
Casyopée also allows to enter an equation g(t)=h(t) and to solve in exact or approximate mode. Approximate mode is adequate here. Casyopée applies the Newton method, starting from the cursor position. |
Figure 35 - Equation and approximate solution |
Category : - help
Page read 11170 times


